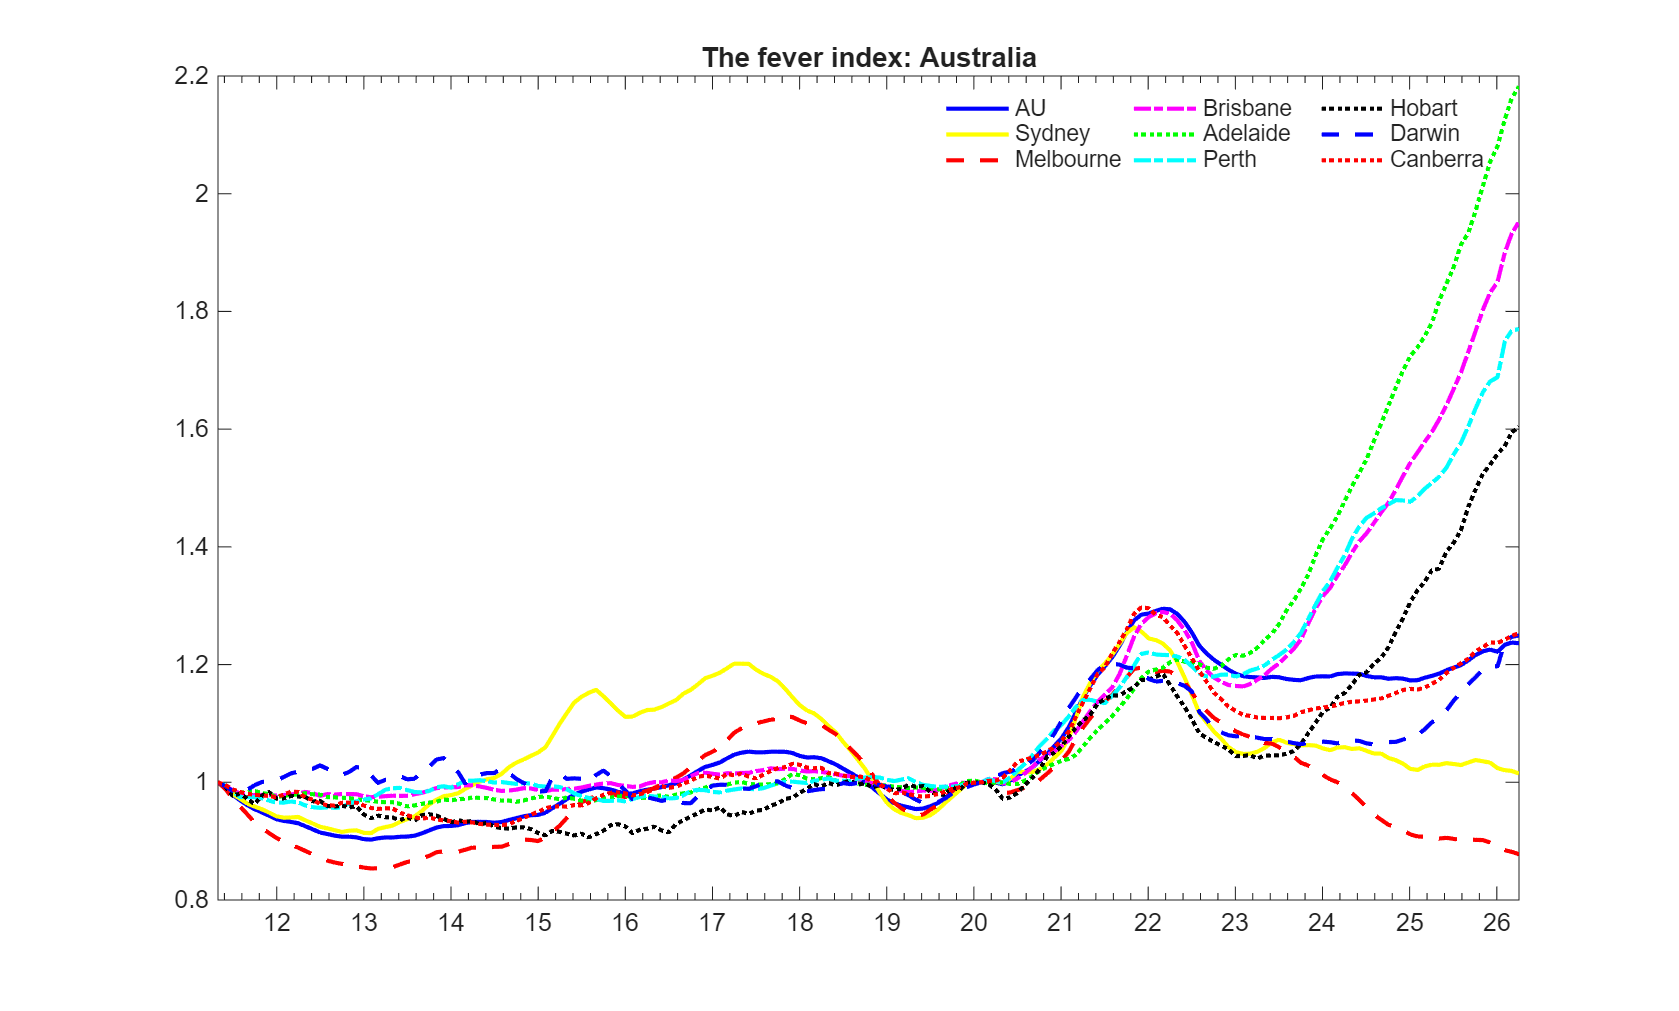
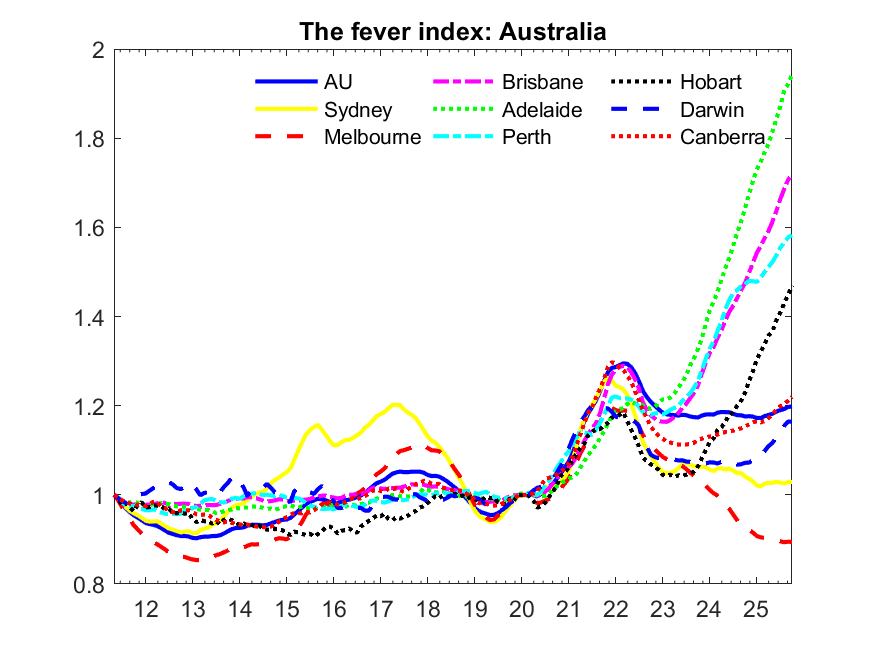
This website provides real-time bubble indicators for housing markets in the eight Australian capital cities and primary New Zealand regions. These indicators provide a direct quantitative measure of the extent of housing fever in these major metropolitan areas. The measures are benchmarked against housing and macroeconomic fundamentals so that they provide a statistical mechanism for assessing the existence and the degree of speculative behaviour in these housing markets.
The markets considered are as follows.
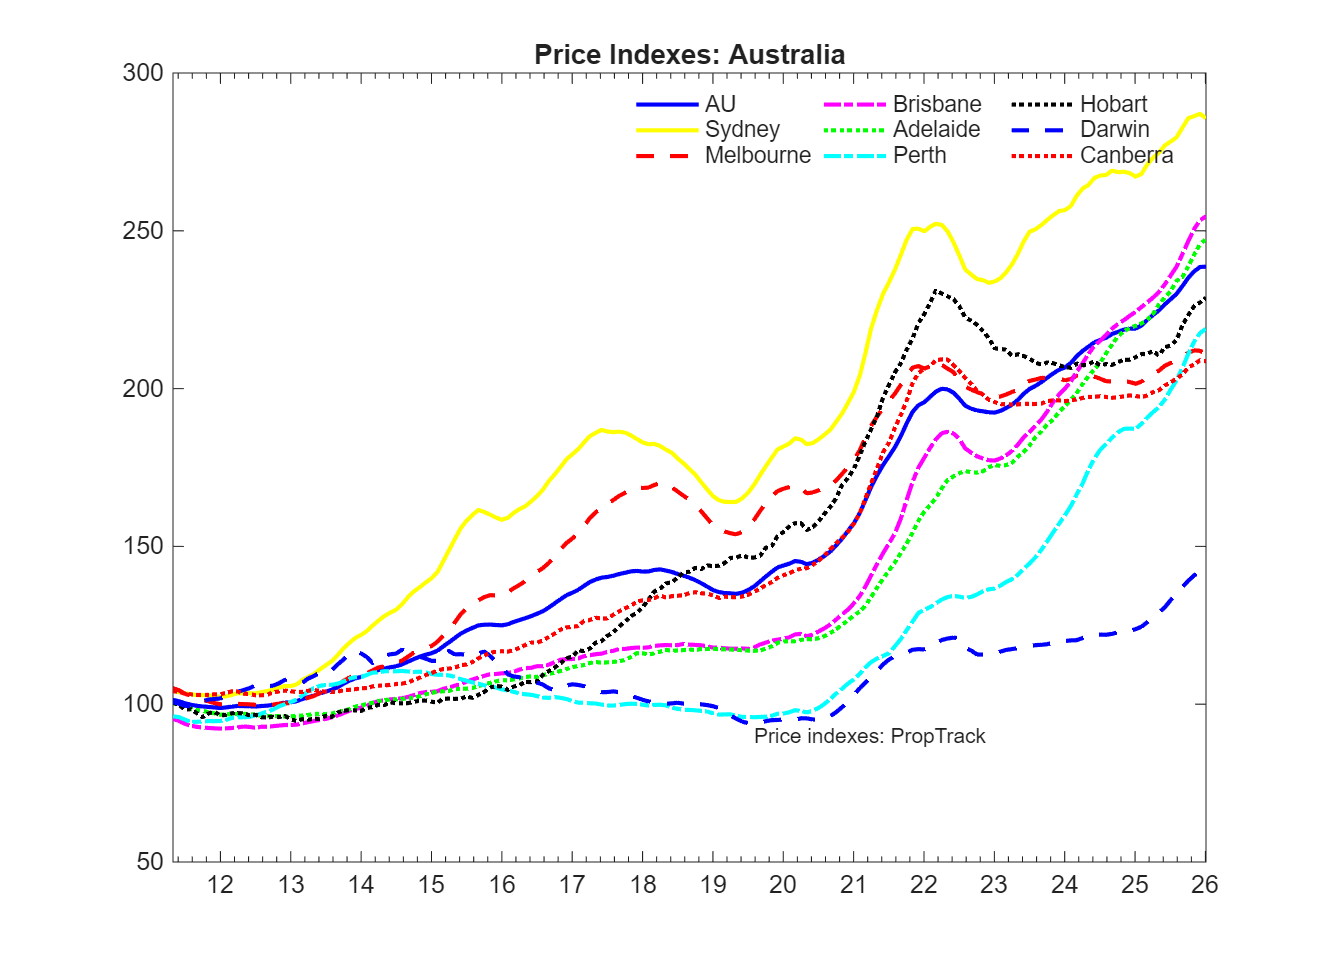
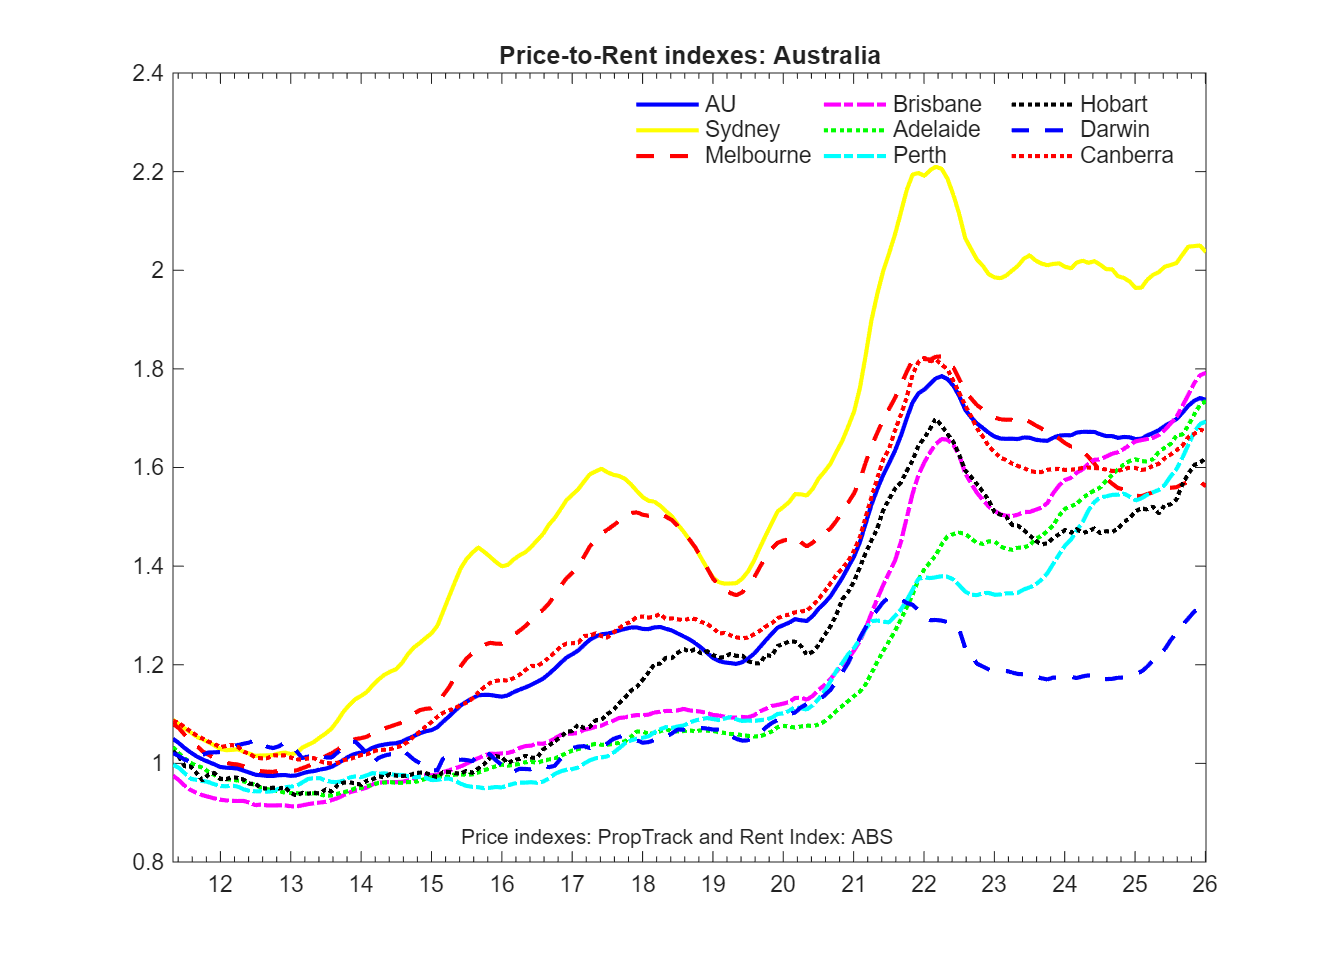
- Australia: Sydney, Melbourne, Brisbane, Adelaide, Perth, Hobart, Darwin, and Canberra
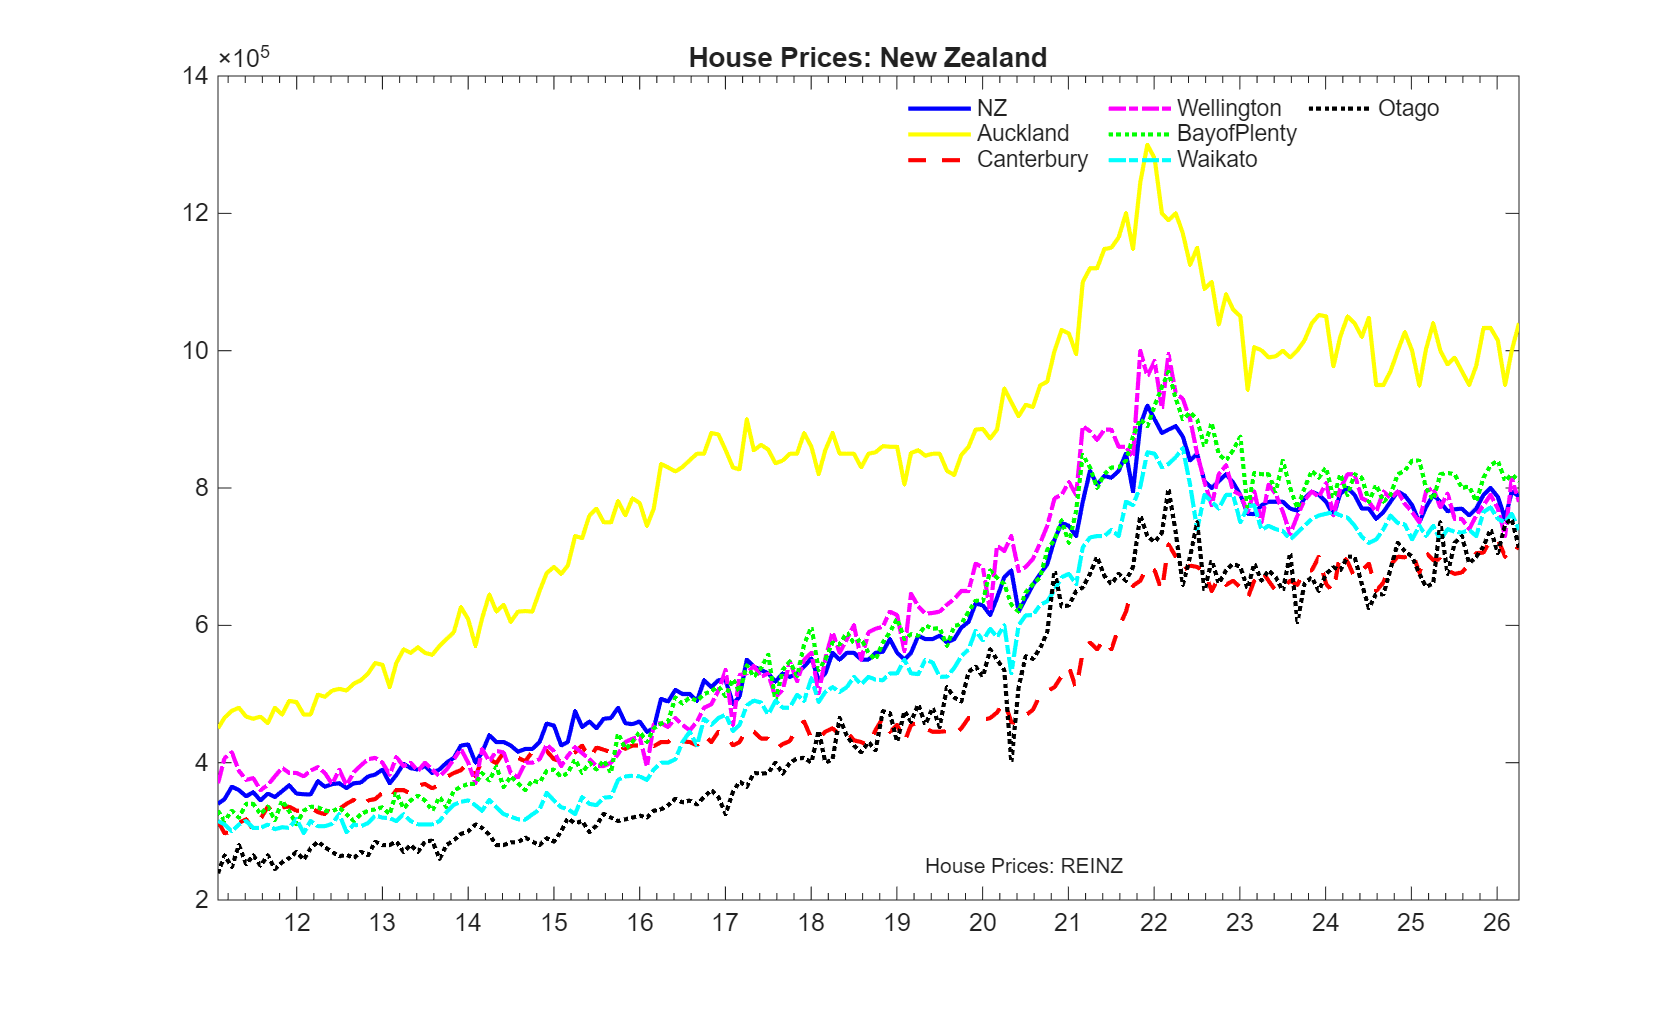
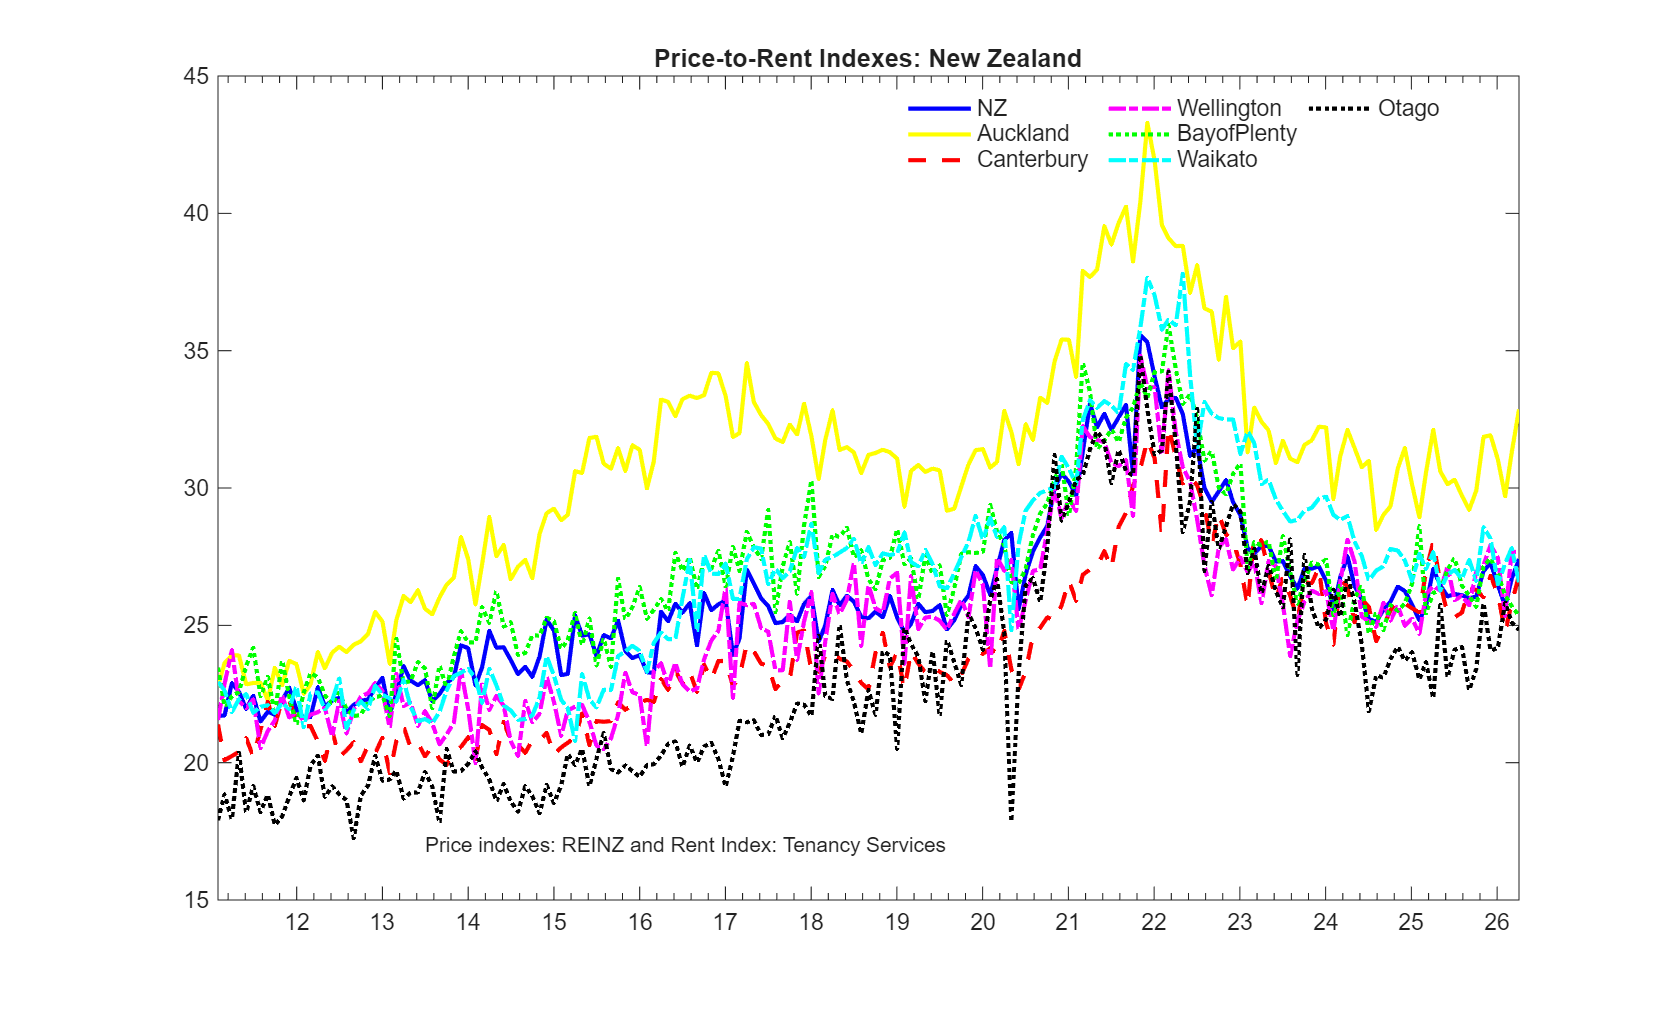
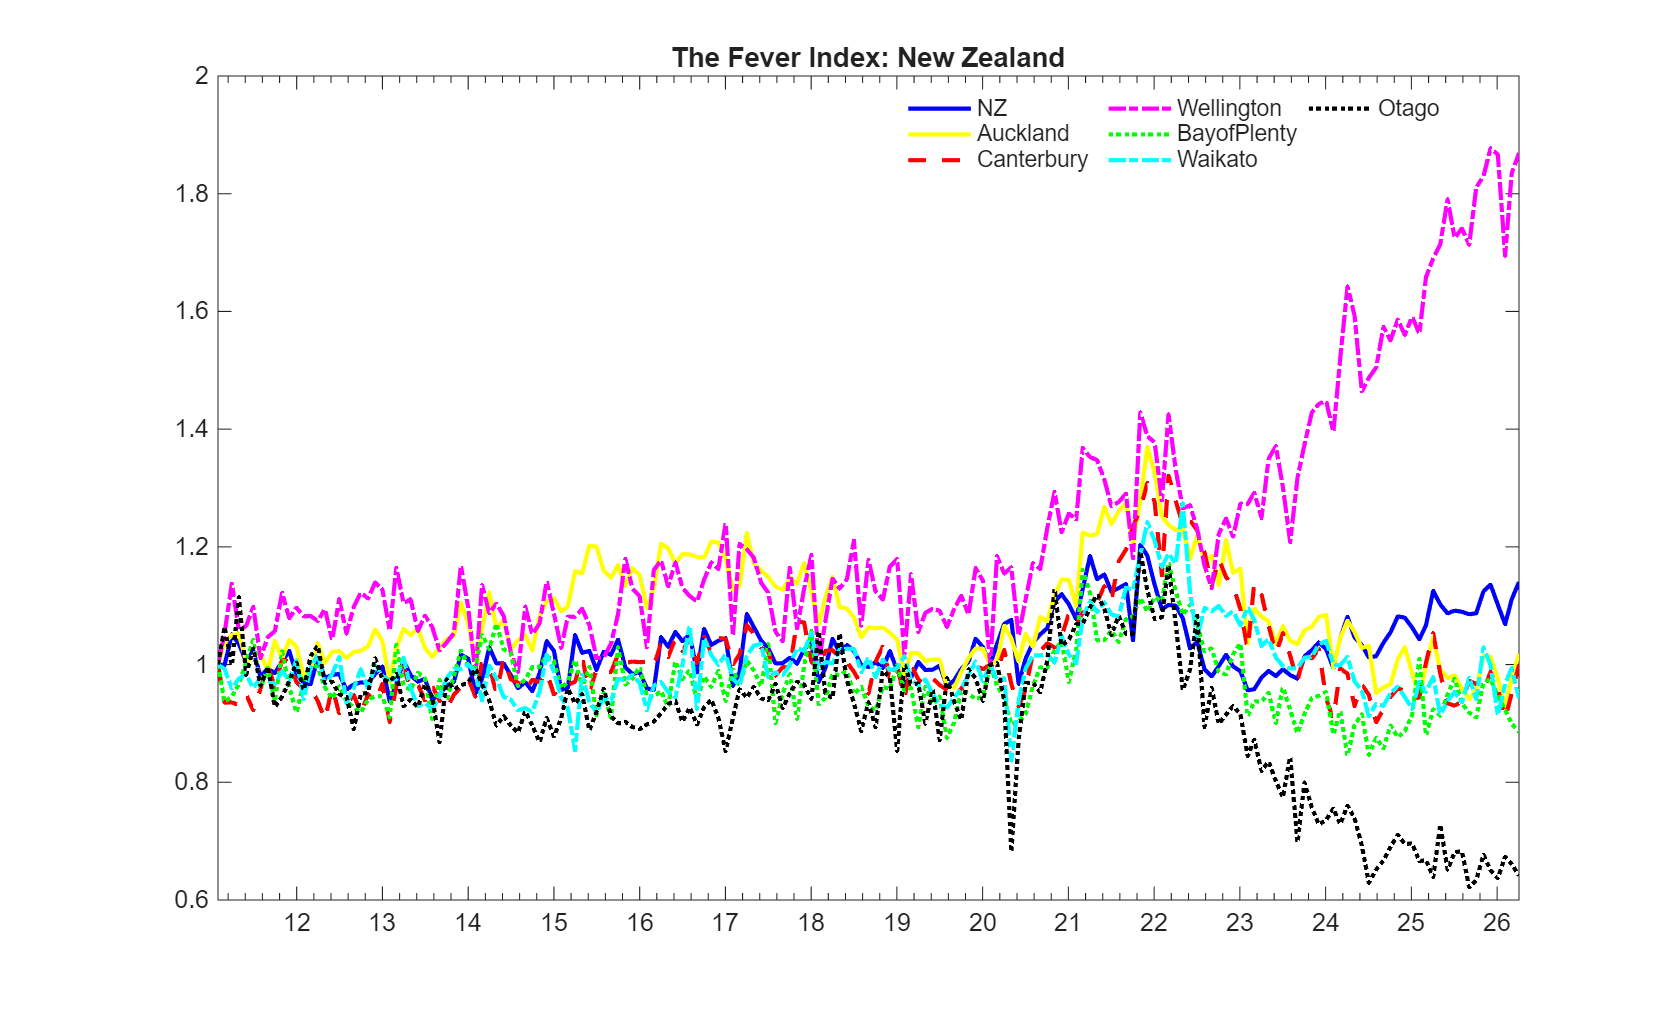
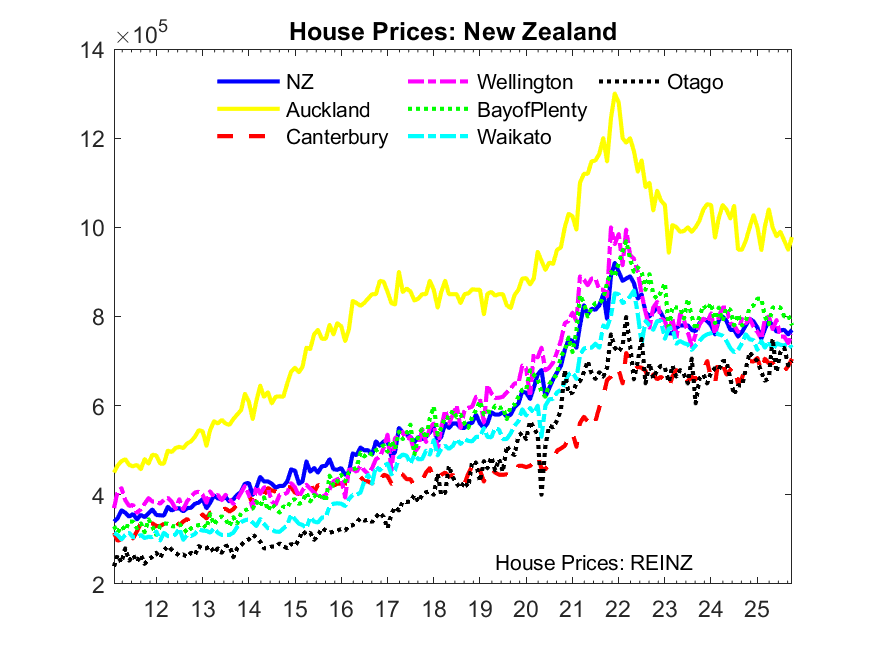
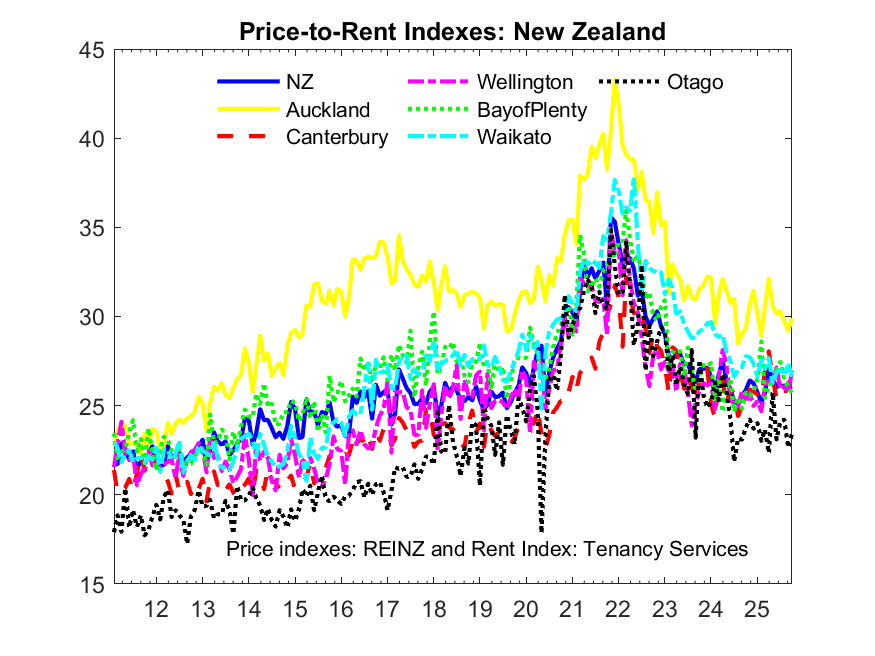
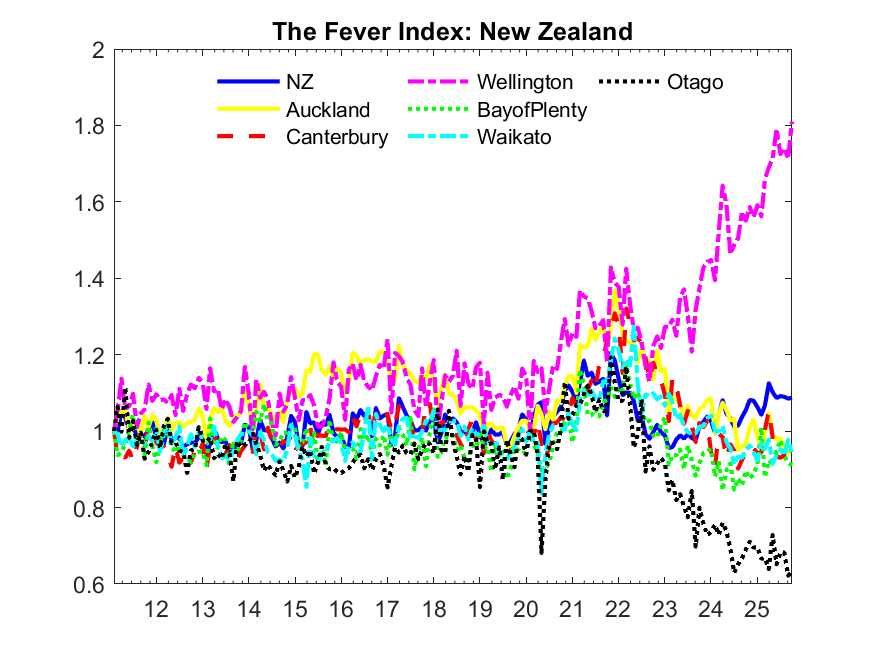
- New Zealand: Auckland, Canterbury, Wellington, Bay of Plenty, Waikato, and Otago
March 2026
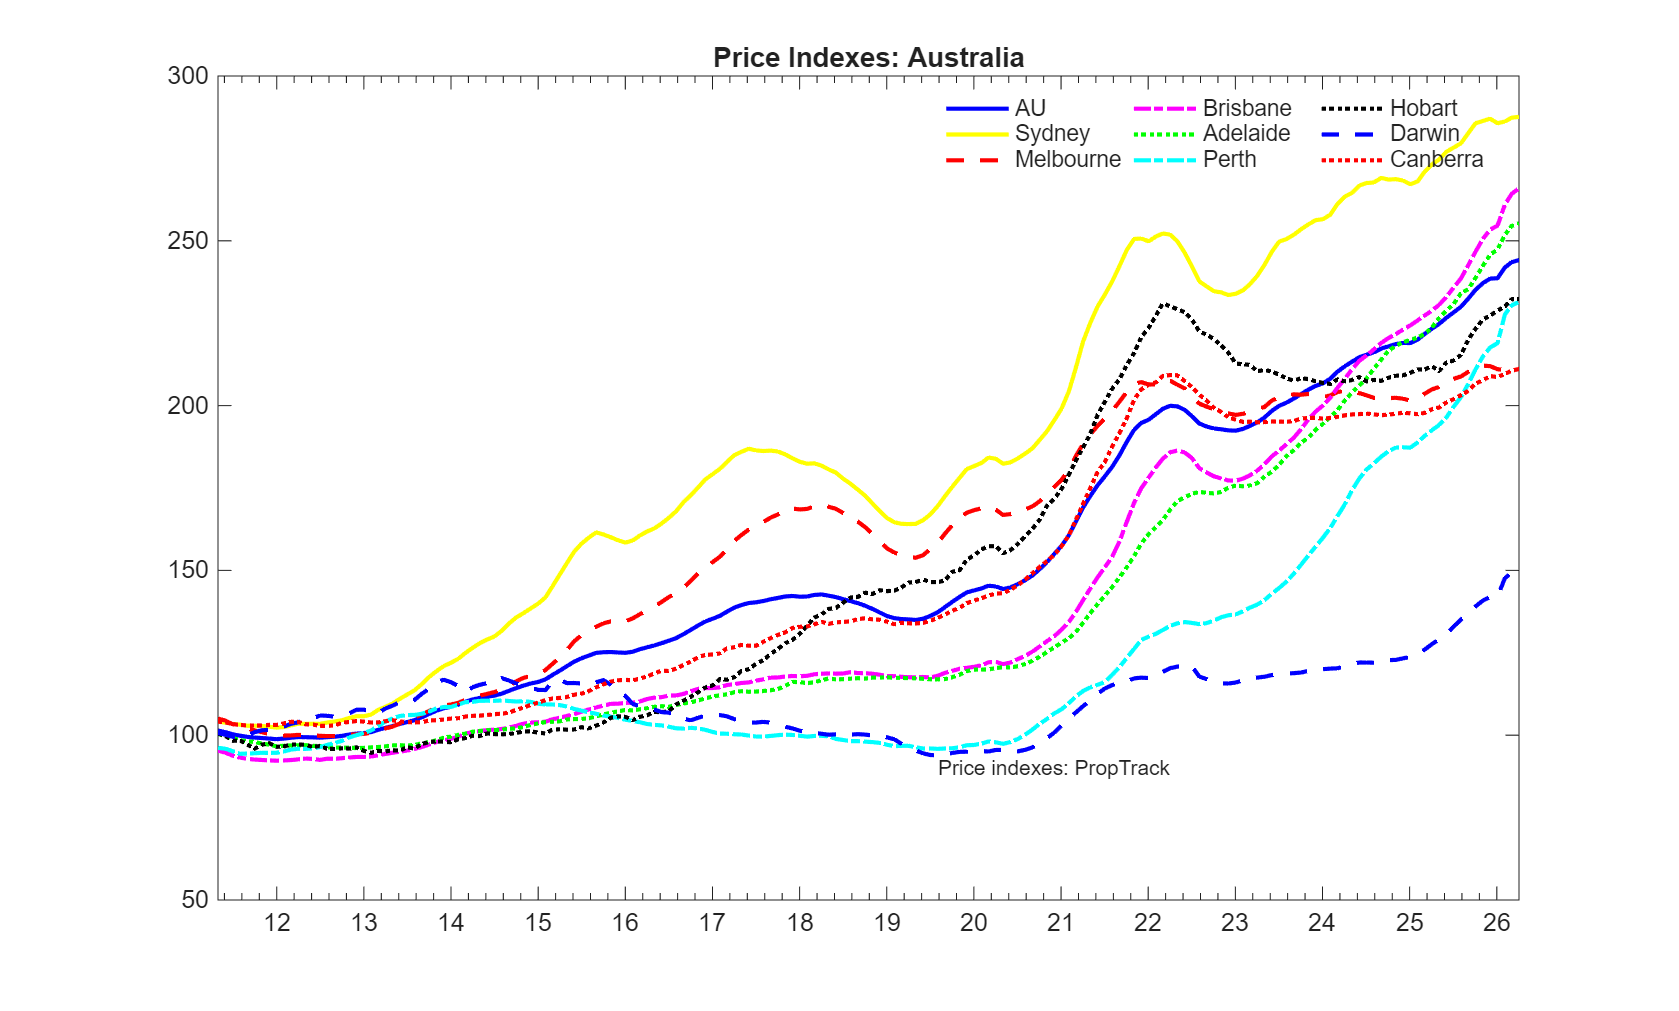
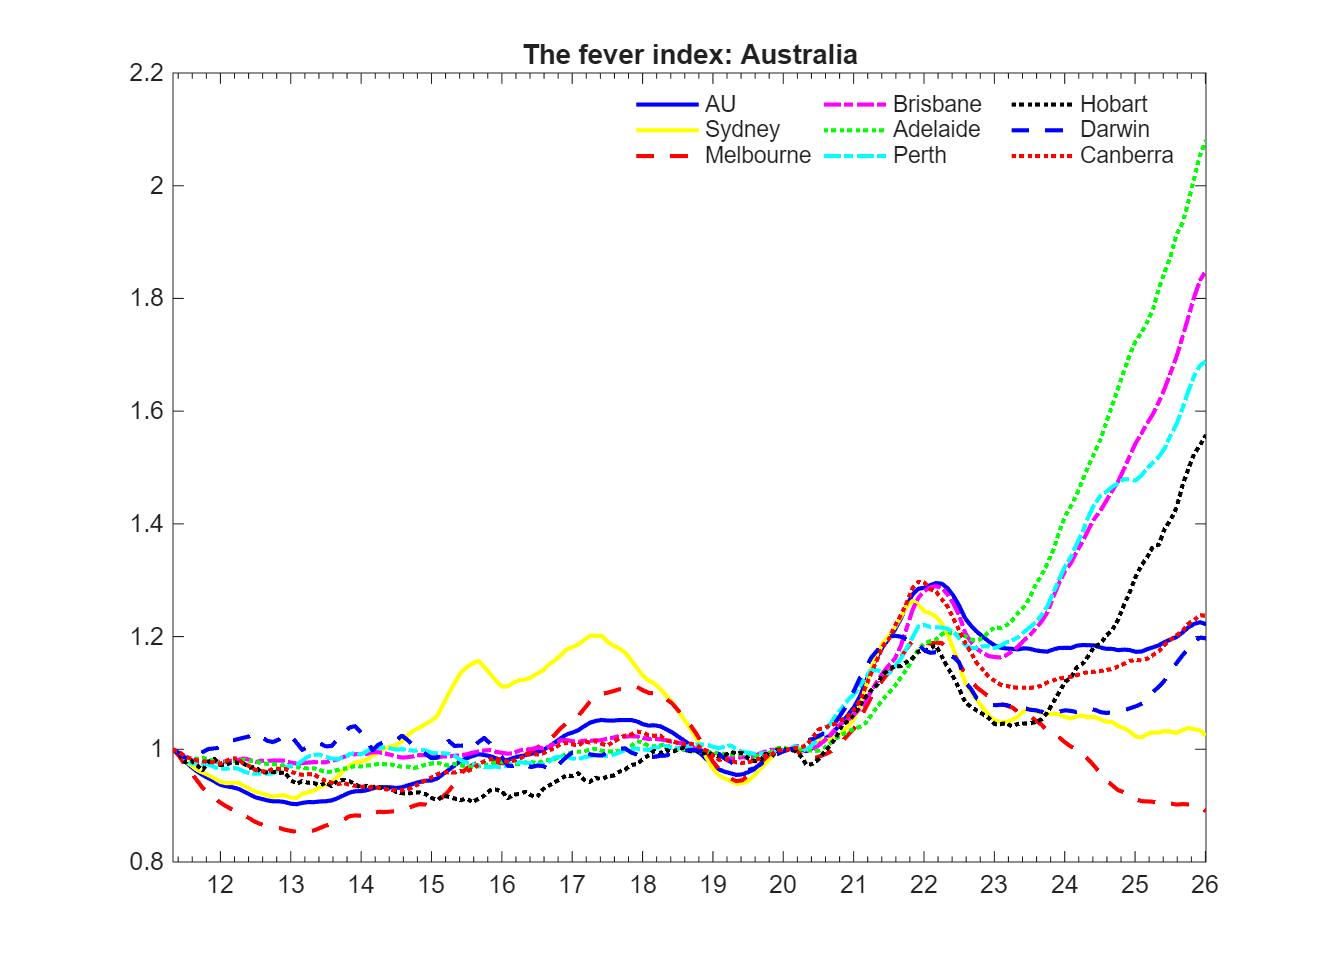
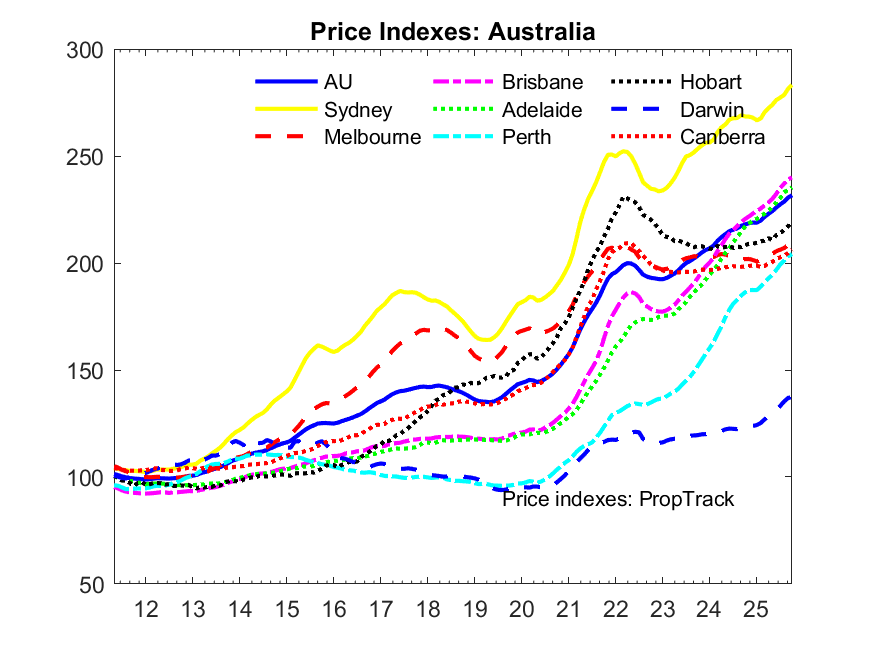
Australia March 2026 shows a growing divergence in Australian capital city housing markets. Brisbane, Adelaide, and Perth are leading a steep upswing in prices, with Darwin also showing a sharp acceleration in recent months. Hobart continues to experience steady growth. In contrast, Canberra and Sydney are plateauing, while Melbourne has begun to show slight price
December 2025
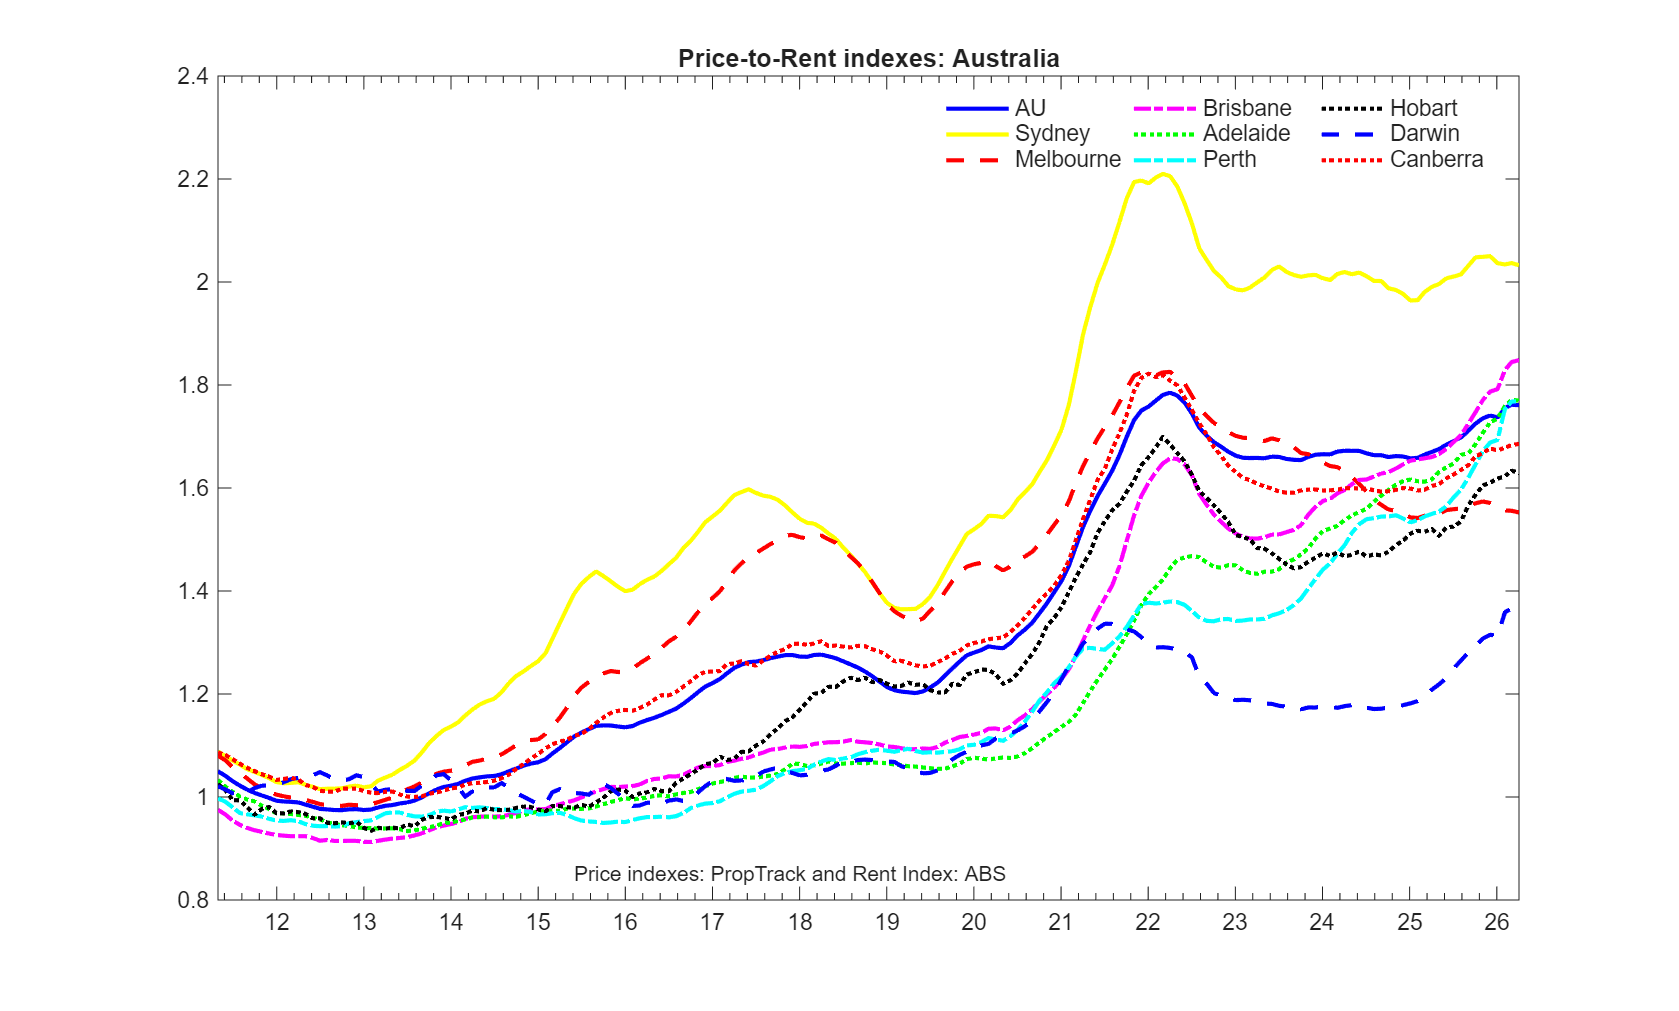
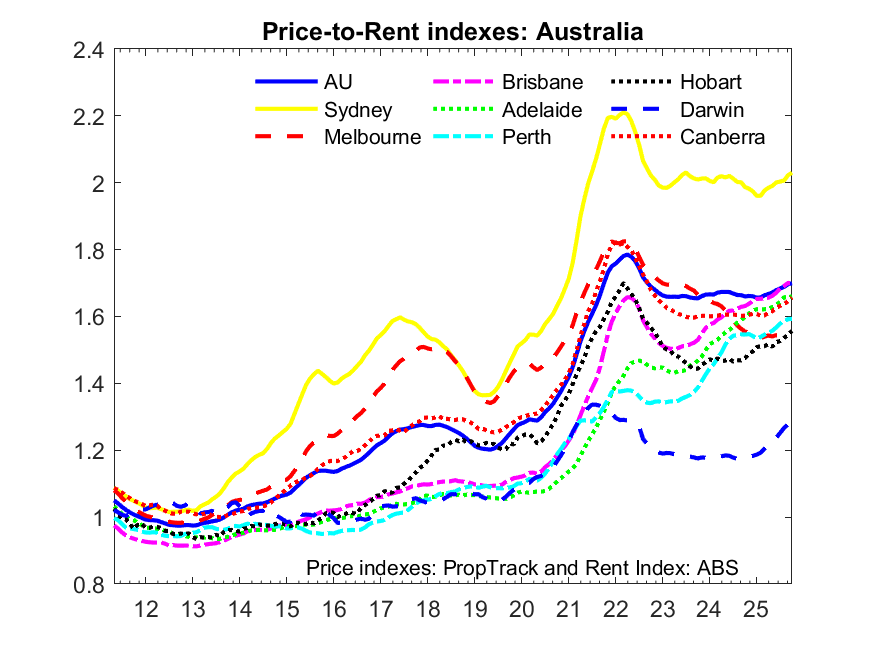
Australia December 2025 found housing prices rising across all Australian capitals but at markedly different speeds. Brisbane, Adelaide, Perth, and Hobart lead the upswing, while Canberra, Melbourne, and Darwin show more subdued growth. Price-to-rent ratios, which focus on the relationship between prices and rental fundamentals, point to renewed valuation pressure in Brisbane, Adelaide, Perth, Hobart,
September 2025
Australia The Australian housing market maintained upward momentum into mid-2025, though regional patterns diverged. Sydney and Darwin prices have resumed growth after a short period of consolidation, while Perth, Adelaide, and Brisbane continue to accelerate more sharply. Hobart remains below its 2022 peak, showing a gradual recovery, and Melbourne remains largely flat. Overall, national prices
This project is supported by the Australian Research Council under Project No. DP190102049.